在计算机性能调试领域里,profiling 是指对应用程序的画像--应用程序使用 CPU 和内存的情况。 Go 语言是一个对性能特别看重的语言,因此语言自带了 profiling 的库。这篇文章就要讲解怎么在 golang 中做 profiling。
本文主要如何通过程序画像对 go 程序进行性能调优,包括 pprof 和 trace 图的使用,进而通过测评结果指导调优方向。
演示环境为 Go 1.16.3。
# runtime/pprof
pprof 是 go 官方提供的性能测评工具,包含在 net/http/pprof 和 runtime/pprof 两个包,分别用于不同场景
- runtime/pprof 主要用于可结束的代码块,如一次编解码操作等
- net/http/pprof 是对 runtime/pprof 的二次封装,主要用于不可结束的代码块,如 web 应用等
pprof 开启后,每隔一段时间(10ms)就会收集下当前的堆栈信息,获取各个函数占用的 CPU 以及内存资源,最后通过对这些采样数据进行分析,形成一个性能分析报告。
我们先看看如何利用 runtime/pprof 进行性能测评。
下列代码循环向一个列表尾部添加元素。导入 runtime/pprof 并添加两段测评代码(补充具体行号)就可以实现 CPU 和内存的性能评测。
// counter_v1.go
package main

import (
	"flag"
	"log"
	"os"
	"runtime/pprof"
	"sync"
)

var (
	cpu string
	mem string
)

func init() {
	flag.StringVar(&cpu, "cpu", "", "write cpu profile to file")
	flag.StringVar(&mem, "mem", "", "write mem profile to file")
}

func main() {
	flag.Parse()

	//采样 CPU 运行状态
	if cpu != "" {
		f, err := os.Create(cpu)
		if err != nil {
			log.Fatal(err)
		}
		_ = pprof.StartCPUProfile(f)
		defer pprof.StopCPUProfile()
	}

	var wg sync.WaitGroup
	wg.Add(100)
	for i := 0; i < 100; i++ {
		go workOnce(&wg)
	}
	wg.Wait()

	//采样内存状态
	if mem != "" {
		f, err := os.Create(mem)
		if err != nil {
			log.Fatal(err)
		}
		_ = pprof.WriteHeapProfile(f)
		f.Close()
	}
}

func counter() {
	slice := make([]int, 0)
	var c int
	for i := 0; i < 100000; i++ {
		c = i + 1 + 2 + 3 + 4 + 5
		slice = append(slice, c)
	}
	_ = slice
}

func workOnce(wg *sync.WaitGroup) {
	counter()
	wg.Done()
}
2
3
4
5
6
7
8
9
10
11
12
13
14
15
16
17
18
19
20
21
22
23
24
25
26
27
28
29
30
31
32
33
34
35
36
37
38
39
40
41
42
43
44
45
46
47
48
49
50
51
52
53
54
55
56
57
58
59
60
61
62
63
64
65
66
编译并执行获得 pprof 的采样数据,然后利用相关工具进行分析。
go build -o app counter_v1.go
./app --cpu=cpu.pprof
./app --mem=mem.pprof
2
3
至此就可以获得 cpu.pprof 和 mem.pprof 两个采样文件,然后利用 go tool pprof 工具进行分析如下。
go tool pprof cpu.pprof
Type: cpu
Time: Apr 12, 2021 at 10:42pm (CST)
Duration: 201.51ms, Total samples = 310ms (153.84%)
Entering interactive mode (type "help" for commands, "o" for options)
(pprof) top
Showing nodes accounting for 310ms, 100% of 310ms total
Showing top 10 nodes out of 58
      flat  flat%   sum%        cum   cum%
     150ms 48.39% 48.39%      150ms 48.39%  runtime.memmove
      50ms 16.13% 64.52%       50ms 16.13%  runtime.memclrNoHeapPointers
      50ms 16.13% 80.65%       50ms 16.13%  runtime.usleep
      10ms  3.23% 83.87%       10ms  3.23%  runtime.madvise
      10ms  3.23% 87.10%       10ms  3.23%  runtime.markBits.isMarked
      10ms  3.23% 90.32%       10ms  3.23%  runtime.procyield
      10ms  3.23% 93.55%       10ms  3.23%  runtime.pthread_cond_wait
      10ms  3.23% 96.77%       10ms  3.23%  runtime.pthread_kill
      10ms  3.23%   100%       10ms  3.23%  runtime.scanobject
         0     0%   100%      210ms 67.74%  main.counter
(pprof)
2
3
4
5
6
7
8
9
10
11
12
13
14
15
16
17
18
19
20
相关字段如下(Type 和 Time 字段就不过多解释了):
| 字段 | 说明 |
|---|---|
| Duration | 程序执行时间。本例中 go 自动分配任务给多个核执行程序,总计耗时 201.51ms,而采样时间为 310ms;也就是说假设有 10 核执行程序,平均每个核采样 31ms 的数据。 |
| (pprof) | 命令行提示。表示当前正在执行 go 的 pprof 工具命令行中,其他工具有 cgo、doc、pprof、test2json、trace 等 |
| top | pprof 的指令之一,显示 pprof 文件的前 10 项数据,可以通过 top 20 等方式显示前 20 行数据。pprof 还有很多指令,例如 list、pdf、eog 等等 |
| flat/flat% | 分别表示在当前层级的 CPU 占用时间和百分比。例如 runtime.memmove 在当前层级占用 CPU 时间 150ms,占比本次采集时间的 48.39% |
| cum/cum% | 分别表示截止到当前层级累积的 CPU 时间和占比。例如 main.counter 累积占用时间 210ms,占本次采集时间的 67.74% |
| sum% | 所有层级的 CPU 时间累积占用,从小到大一直累积到 100%,即 310ms |
由上图的 cum 数据可以看到,counter 函数的 CPU 占用时间最多。接下来可利用 list 命令查看占用的主要因素如下
(pprof) list main.counter
Total: 310ms
ROUTINE ======================== main.counter in /Users/sammy/Workspaces/github.com/sammyne/go-profiling/code/counter_v1.go
         0      210ms (flat, cum) 67.74% of Total
         .          .     52:func counter() {
         .          .     53:   slice := make([]int, 0)
         .          .     54:   var c int
         .          .     55:   for i := 0; i < 100000; i++ {
         .          .     56:           c = i + 1 + 2 + 3 + 4 + 5
         .      210ms     57:           slice = append(slice, c)
         .          .     58:   }
         .          .     59:   _ = slice
         .          .     60:}
         .          .     61:
         .          .     62:func workOnce(wg *sync.WaitGroup) {
(pprof)
2
3
4
5
6
7
8
9
10
11
12
13
14
15
16
可见,程序的 57 行分别占用 210ms,这就是优化的主要方向。通过分析程序发现,由于切片的初始容量为 0,导致循环 append 时触发多次扩容。切片的扩容方式是:申请 2 倍或者 1.25 倍的原来长度的新切片,再将原来的切片数据拷贝进去。
仔细一看还会发现:runtime.usleep 占用 CPU 时间将近 16.13%,但是程序明明没有任何 sleep 相关的代码,却为什么会出现,并且还占用这么高呢?大家可以先思考一下,后文将揭晓。
当然,也可以使用 web 命令获得更加直观的信息。macOS 通过如下命令安装渲染工具 graphviz。
brew install graphviz
安装完成后,在 pprof 的命令行输入 svg 即可生成一个 svg 格式的文件,将其用浏览器打开即可看到 此图。
由于文件过大,此处只截取部分重要内容如下。

可以看出其基本信息和命令行下的信息相同,但是可以明显看出 runtime.memmove 耗时 380ms。由图逆向推断 main.counter 是主要的优化方向。图中各个方块的大小也代表 CPU 占用的情况,方块越大说明占用 CPU 时间越长。
同理可以分析 mem.pprof 文件,从而得出内存消耗的主要原因进一步进行改进。
上述 main.counter 占用 CPU 时间过多的问题,实际上是 append 函数重新分配内存造成的。那简单的做法就是事先申请一个大的内存,避免频繁的进行内存分配。所以将 counter 函数进行改造:
func counter() {
	var slice [100000]int
	var c int
	for i := 0; i < 100000; i++ {
		c = i + 1 + 2 + 3 + 4 + 5
		slice[i] = c
	}
	_ = slice
}
2
3
4
5
6
7
8
9
通过编译、运行、采集 pprof 信息后如下图所示。
➜  code git:(main) ✗ go build -o app counter_v2.go
➜  code git:(main) ✗ ./app --cpu=cpu.pprof
➜  code git:(main) ✗ go tool pprof cpu.pprof
Type: cpu
Time: Apr 14, 2021 at 10:04pm (CST)
Duration: 200.52ms, Total samples = 0
No samples were found with the default sample value type.
Try "sample_index" command to analyze different sample values.
Entering interactive mode (type "help" for commands, "o" for options)
(pprof)
2
3
4
5
6
7
8
9
10
可见,已经采集不到占用 CPU 比较多的函数,即已经完成优化。同学们可以试试如果往 counter 添加一个 fmt.Println 函数后,对 CPU 占用会有什么影响呢?
# net/http/pprof
针对后台服务型应用,服务一般不能停止,这时需要使用 net/http/pprof 包。类似上述代码,编写如下代码:
// +build ignore

package main

import (
	"net/http"
	_ "net/http/pprof"
	"time"
)

var hello []int

func counter() {
	slice := make([]int, 0)
	c := 1
	for i := 0; i < 100000; i++ {
		c = i + 1 + 2 + 3 + 4 + 5
		slice = append(slice, c)
	}
	// 个人实验时,加上这行貌似可以防止 slice 被优化掉,导致无法统计到期望的内存概况
	hello = slice
}

func workForever() {
	for {
		go counter()
		time.Sleep(1 * time.Second)
	}
}

func httpGet(w http.ResponseWriter, r *http.Request) {
	counter()
}

func main() {
	go workForever()
	http.HandleFunc("/get", httpGet)
	http.ListenAndServe("localhost:8000", nil)
}
2
3
4
5
6
7
8
9
10
11
12
13
14
15
16
17
18
19
20
21
22
23
24
25
26
27
28
29
30
31
32
33
34
35
36
37
38
39
首先导入 net/http/pprof 包。注意该包利用下划线 _ 导入,意味着只需要该包运行其 init() 函数即可。这样之后,该包将自动完成信息采集并保存到内存。所以服务上线时需要将 net/http/pprof 包移除,避免其影响服务的性能,更重要的是防止其造成内存的不断上涨。
编译并运行依赖,便可以访问:http://localhost:8000/debug/pprof/ 查看服务的运行情况。本文实验得出如下示例,大家可以自行探究查看。不断刷新网页可以发现采样结果也在不断更新中。

当然也可以网页形式查看。现在以查看内存为例,在服务程序运行时,执行下列命令采集内存信息。
# main 表示编译生成的可执行文件
go tool pprof main http://localhost:8000/debug/pprof/heap
2
采集完成后调用 svg 命令得到如下 svg 文件
go tool pprof main http://localhost:8000/debug/pprof/heap
Fetching profile over HTTP from http://localhost:8000/debug/pprof/heap
Saved profile in /root/pprof/pprof.main.alloc_objects.alloc_space.inuse_objects.inuse_space.005.pb.gz
File: main
Type: inuse_space
Time: Apr 14, 2021 at 2:44pm (UTC)
Entering interactive mode (type "help" for commands, "o" for options)
(pprof) svg
Generating report in profile001.svg
(pprof)
2
3
4
5
6
7
8
9
10
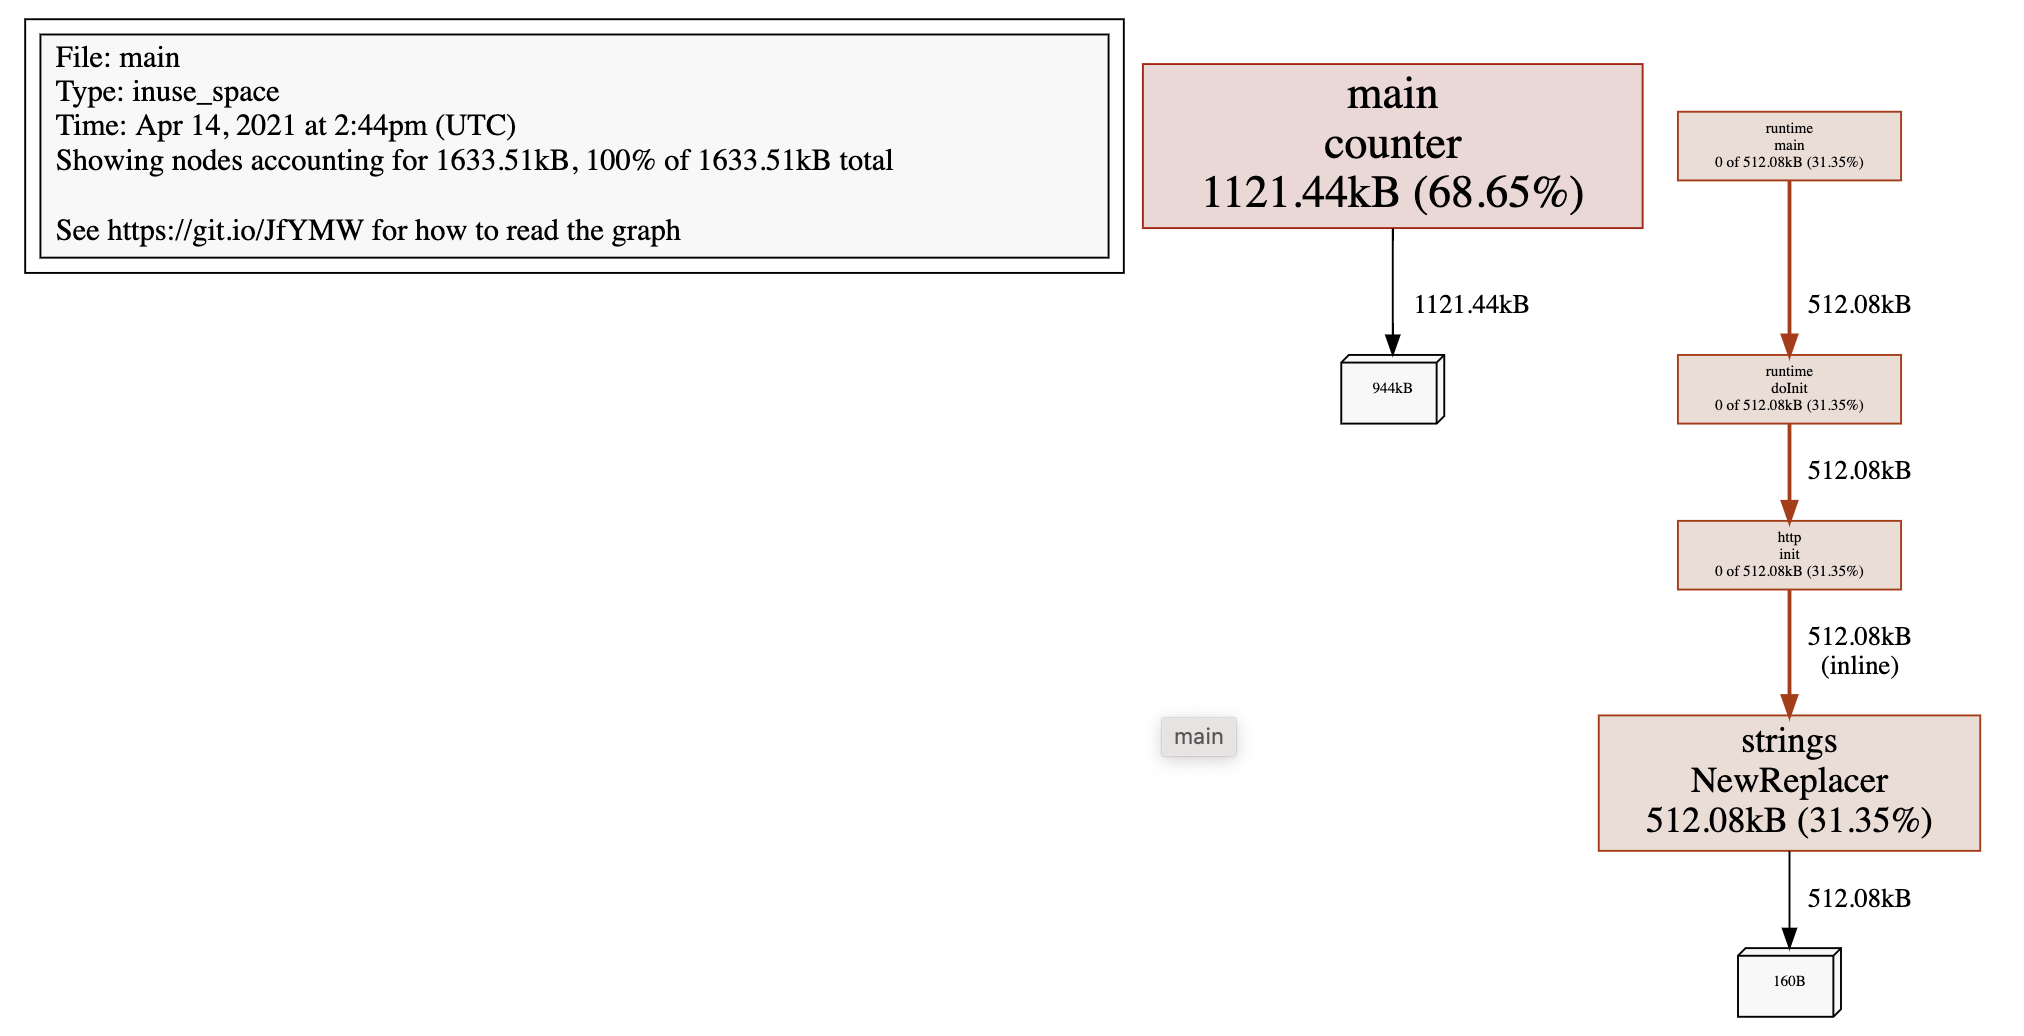
该图表明所有的堆空间均由 counter 产生,同理可以生成 CPU 的 svg 文件用于同步进行分析优化方向。
上述方法在工具型应用可以使用,然而在服务型应用时,仅仅只是采样了部分代码段;而只有当有大量请求时才能看到应用服务的主要优化信息。
另外,Uber 开源的火焰图工具 go-torch (opens new window) 也能辅助我们直观地完成测评。感兴趣的话,请自行学习。
值得注意的是:pprof 也会使用堆空间,所以在服务上线时应该将 pprof 关闭。
# trace
trace 工具也是 go 工具之一,能够辅助我们跟踪程序的执行情况,进一步方便我们排查问题,往往配合 pprof 使用。trace 的使用和 pprof 类似,为了简化分析,我们首先利用下列代码进行讲解,只是用单核核运行程序:
// +build ignore

package main

import (
	"flag"
	"log"
	"os"
	"runtime"
	"runtime/trace"
	"sync"
)

var hello []int

func counter(wg *sync.WaitGroup) {
	defer wg.Done()

	slice := []int{0}
	c := 1
	for i := 0; i < 100000; i++ {
		c = i + 1 + 2 + 3 + 4 + 5
		slice = append(slice, c)
	}
	hello = slice
}

func main() {
	runtime.GOMAXPROCS(1)

	var traceProfile = flag.String("traceprofile", "trace.pprof", "write trace profile to file")
	flag.Parse()

	if *traceProfile != "" {
		f, err := os.Create(*traceProfile)
		if err != nil {
			log.Fatal(err)
		}
		trace.Start(f)
		defer f.Close()
		defer trace.Stop()
	}

	var wg sync.WaitGroup
	wg.Add(3)
	for i := 0; i < 3; i++ {
		go counter(&wg)
	}
	wg.Wait()
}
2
3
4
5
6
7
8
9
10
11
12
13
14
15
16
17
18
19
20
21
22
23
24
25
26
27
28
29
30
31
32
33
34
35
36
37
38
39
40
41
42
43
44
45
46
47
48
49
50
同样,通过编译、执行和如下指令得到 trace 图:
go tool trace -http=127.0.0.1:8000 trace.pprof
图像的查看依赖 Chrome 浏览器。如果依旧无法查看改图像,MacOS 请按照下述方法进行操作
- 登录 google 账号,访问 https://developers.chrome.com/origintrials/#/register_trial/2431943798780067841,其中 web Origin 字段为此后你需要访问的 web 网址,例如我使用的 127.0.0.1:8000。如此你将获得一个 Active Token 并复制下来。
- 在 go 的安装目录
$GOROOT/src/cmd/trace/trace.go文件找到元素范围,并添加 - 在该目录下分别执行 go build 和 go install,此后重启 Chrome 浏览器即可查看上图。
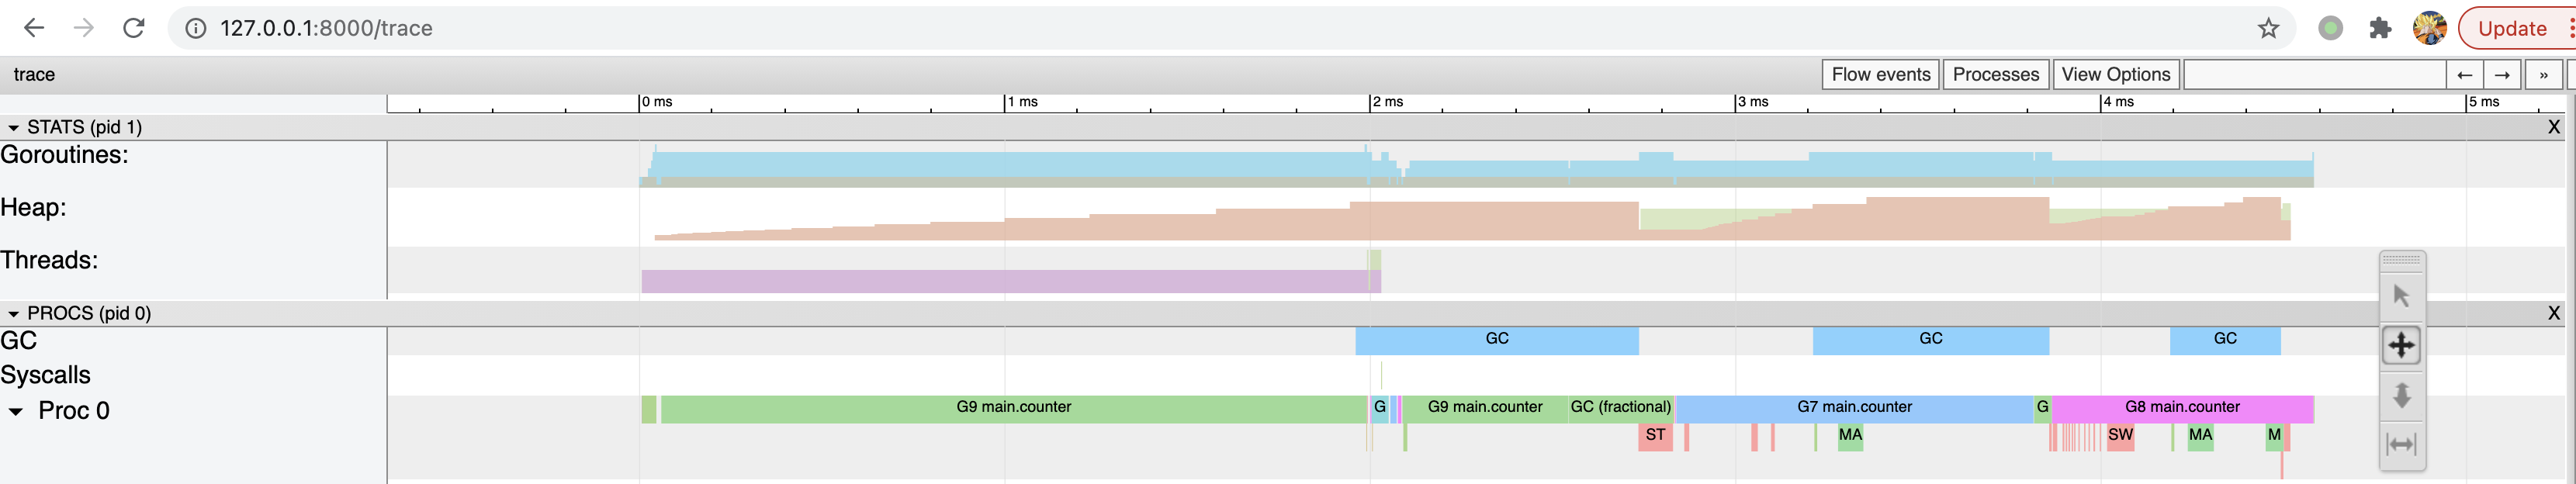
上图有几个关键字段,分别介绍如下:
| 字段 | 说明 |
|---|---|
| Goroutines | 运行中的协程数量;通过点击图中颜色标识可查看相关信息,可以看到在大部分情况下可执行的协程会很多,但是运行中的只有 0 个或 1 个,因为我们只用了 1 核。 |
| Heap | 运行中使用的总堆内存;因为此段代码是有内存分配缺陷的,所以 heap 字段的颜色标识显示堆内存在不断增长中。 |
| Threads | 运行中系统进程数量;很显然只有 1 个。 |
| GC | 系统垃圾回收;在程序的末端开始回收资源。 |
| Syscalls | 系统调用;由上图看到在 GC 开始只有很微少的一段。 |
| Proc0 | 系统进程,与使用的处理器的核数有关,1 个。 |
另外由图可知,程序的总运行时间约 4ms。在 Proc0 轨道上,不同颜色代表不同协程,各个协程都是串行的,执行 counter 函数的有 G6、G7 和 G8 协程,同时 Goroutines 轨道上的协程数量也相应在减少。伴随着协程的结束,GC 也会将内存回收,另外 GC 过程出现了 STW(stop the world)过程,这对程序的执行效率会有极大的影响。STW 过程会将整个程序通过 sleep 停止下来,所以前文出现的 runtime.usleep 就是此时由 GC 调用的。
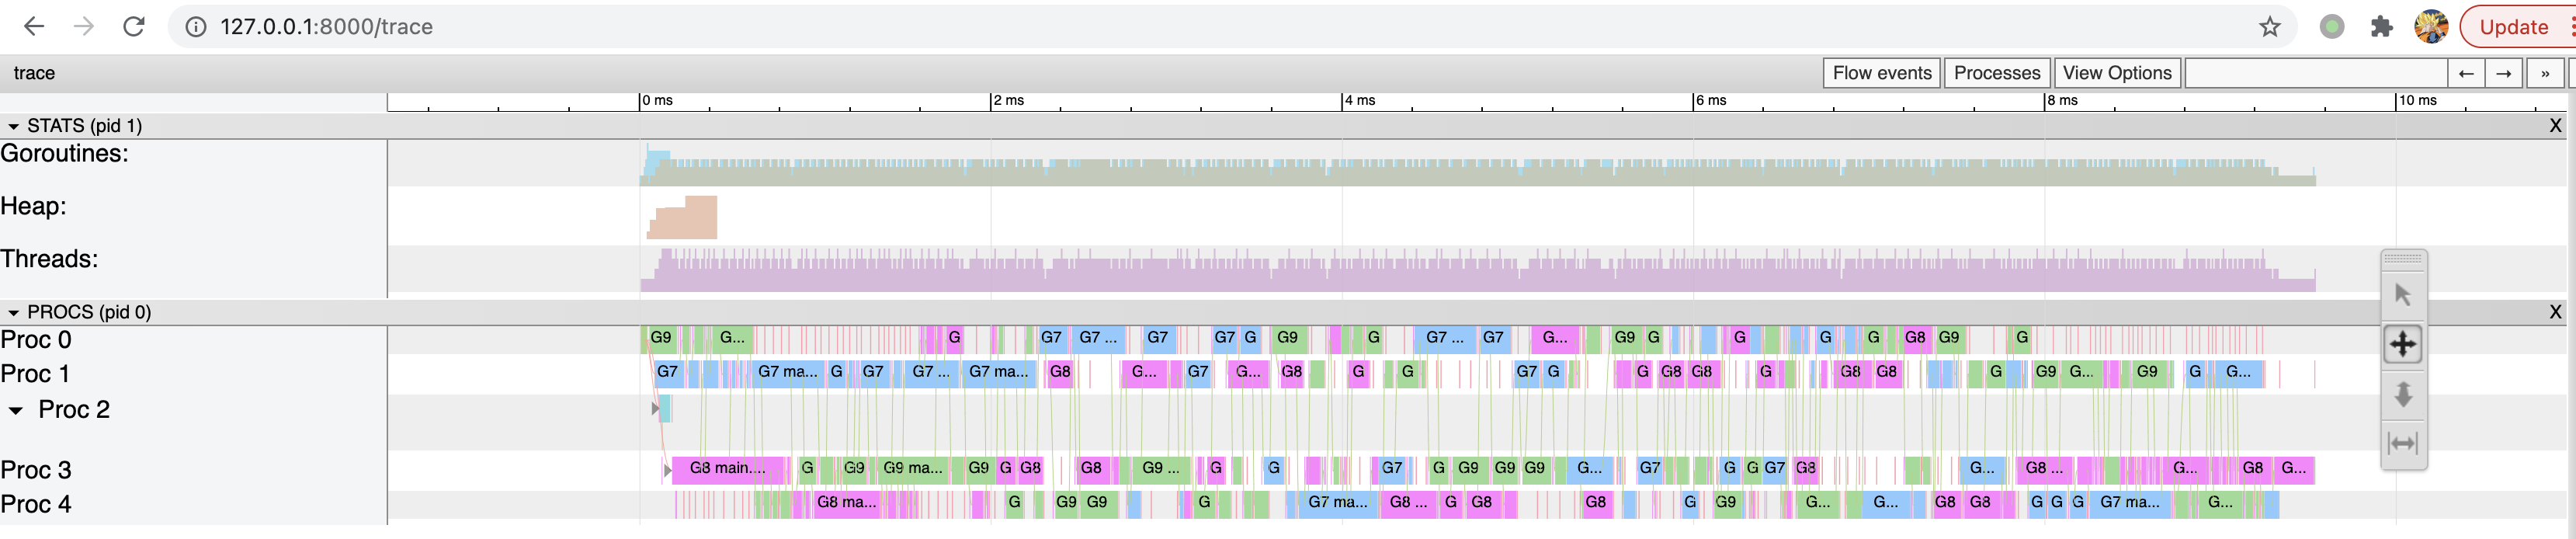
下面我们使用多个核来运行,只需要改动 GOMAXPROCS 即可,例如修改成 5 并获得 trace 图:
runtime.GOMAXPROCS(5)
TODO(结果无法复现):从上图可以看到,3 个 counter 协程在每个核上都有执行,同时程序的运行时间为 TODO(目前实际时间变化不大,甚至增加),运行时间大大降低,可见提高 cpu 核数是可以提高效率的,但是也不是所有场景都适合提高核数,还是需要具体分析。同时为了减少内存的扩容,同样可以预先分配内存,获得 trace 图如下所示:
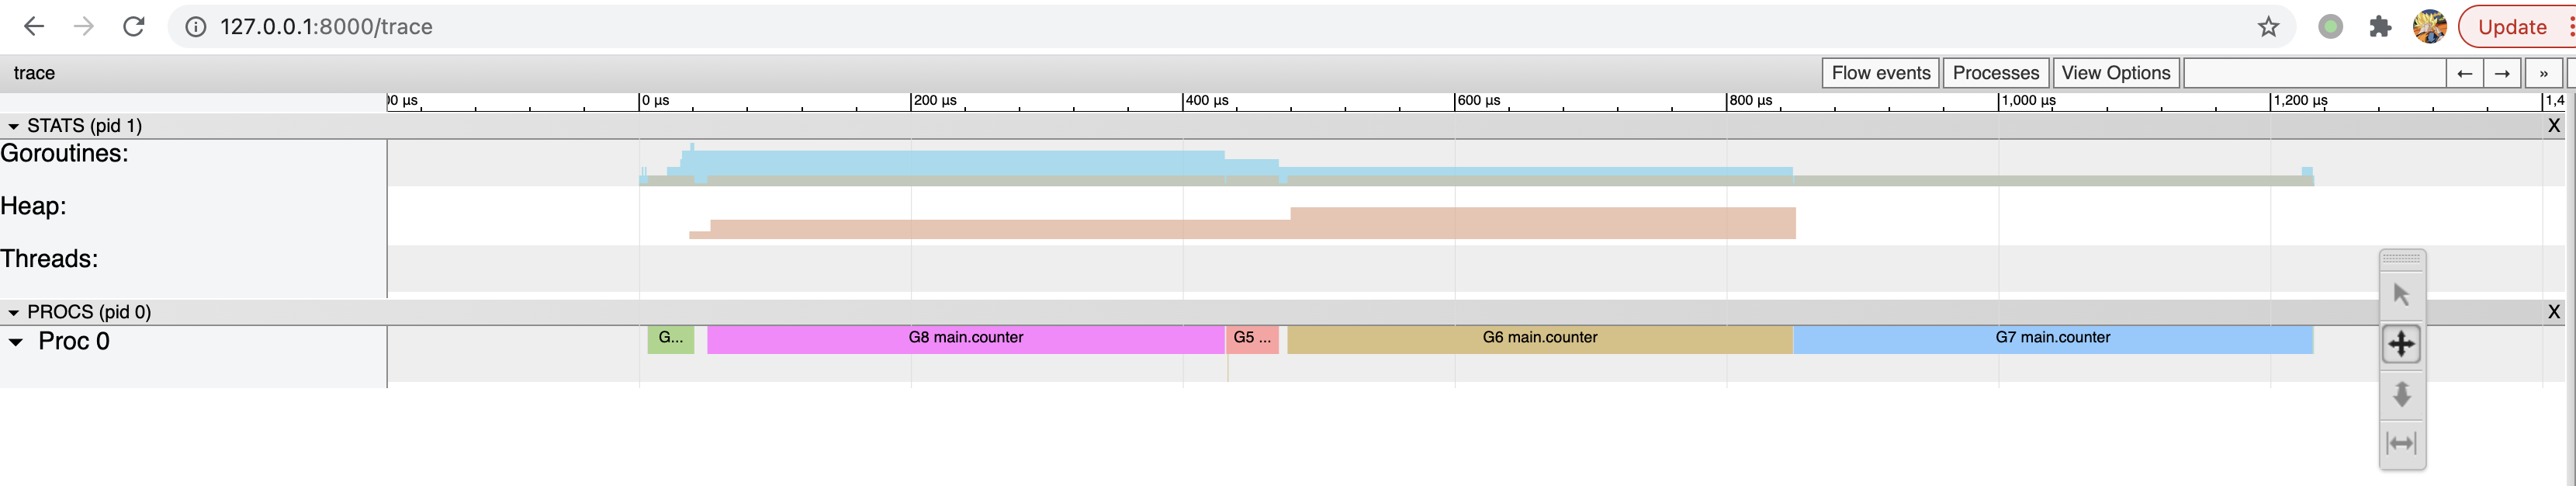
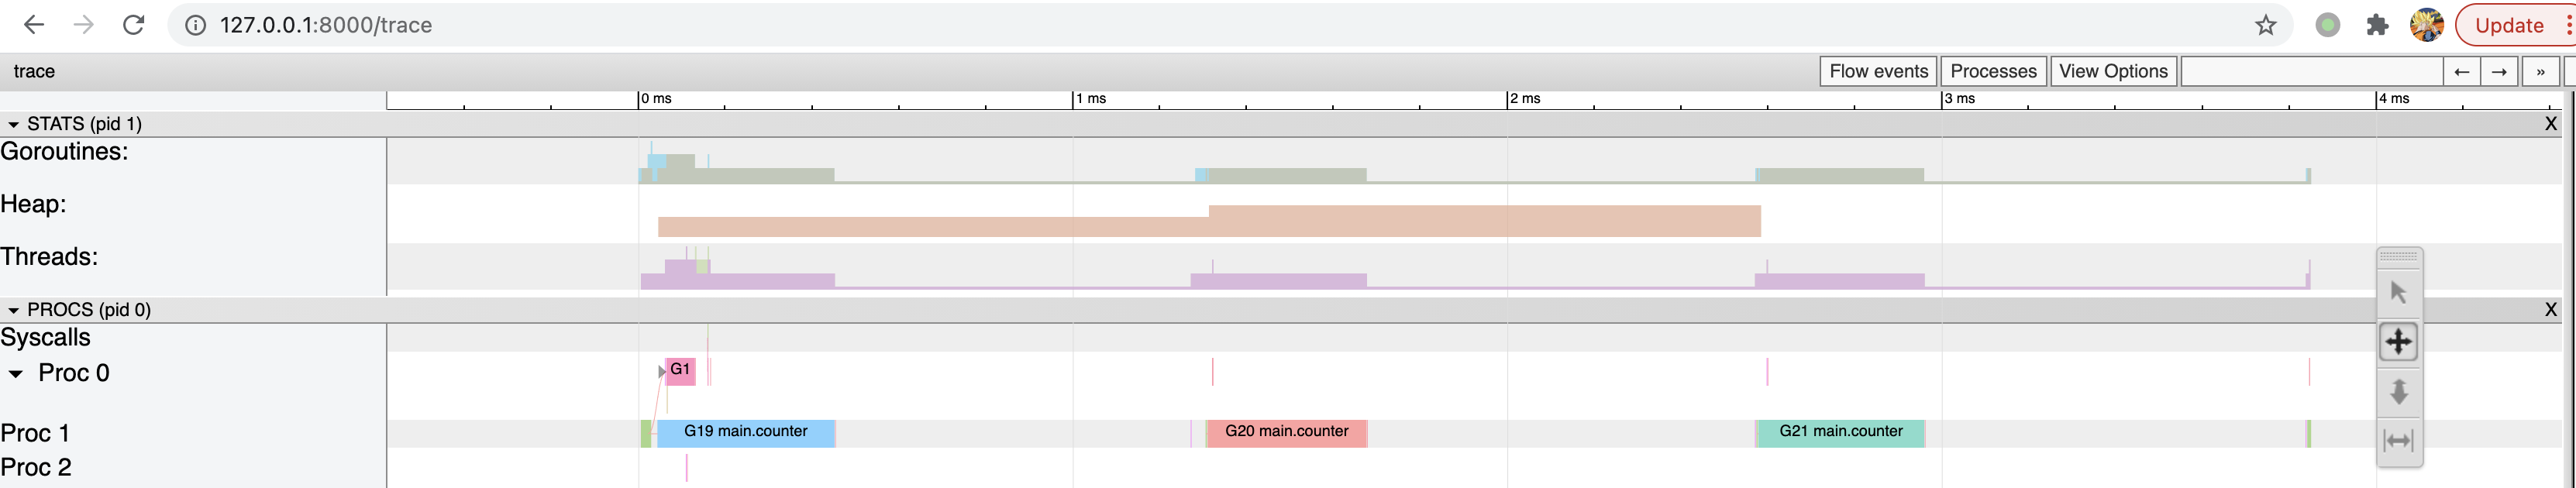
由上图看到,由于我们提前分配好足够的内存,系统不需要进行多次扩容,进而进一步减小开销。从 slice 的源码中看到其实现中包含指针,即其内存是堆内存,而不是 C/C++ 中类似数组的栈空间分配方式。另外也能看到程序的运行时间为 0.18ms,进一步提高运行速度。
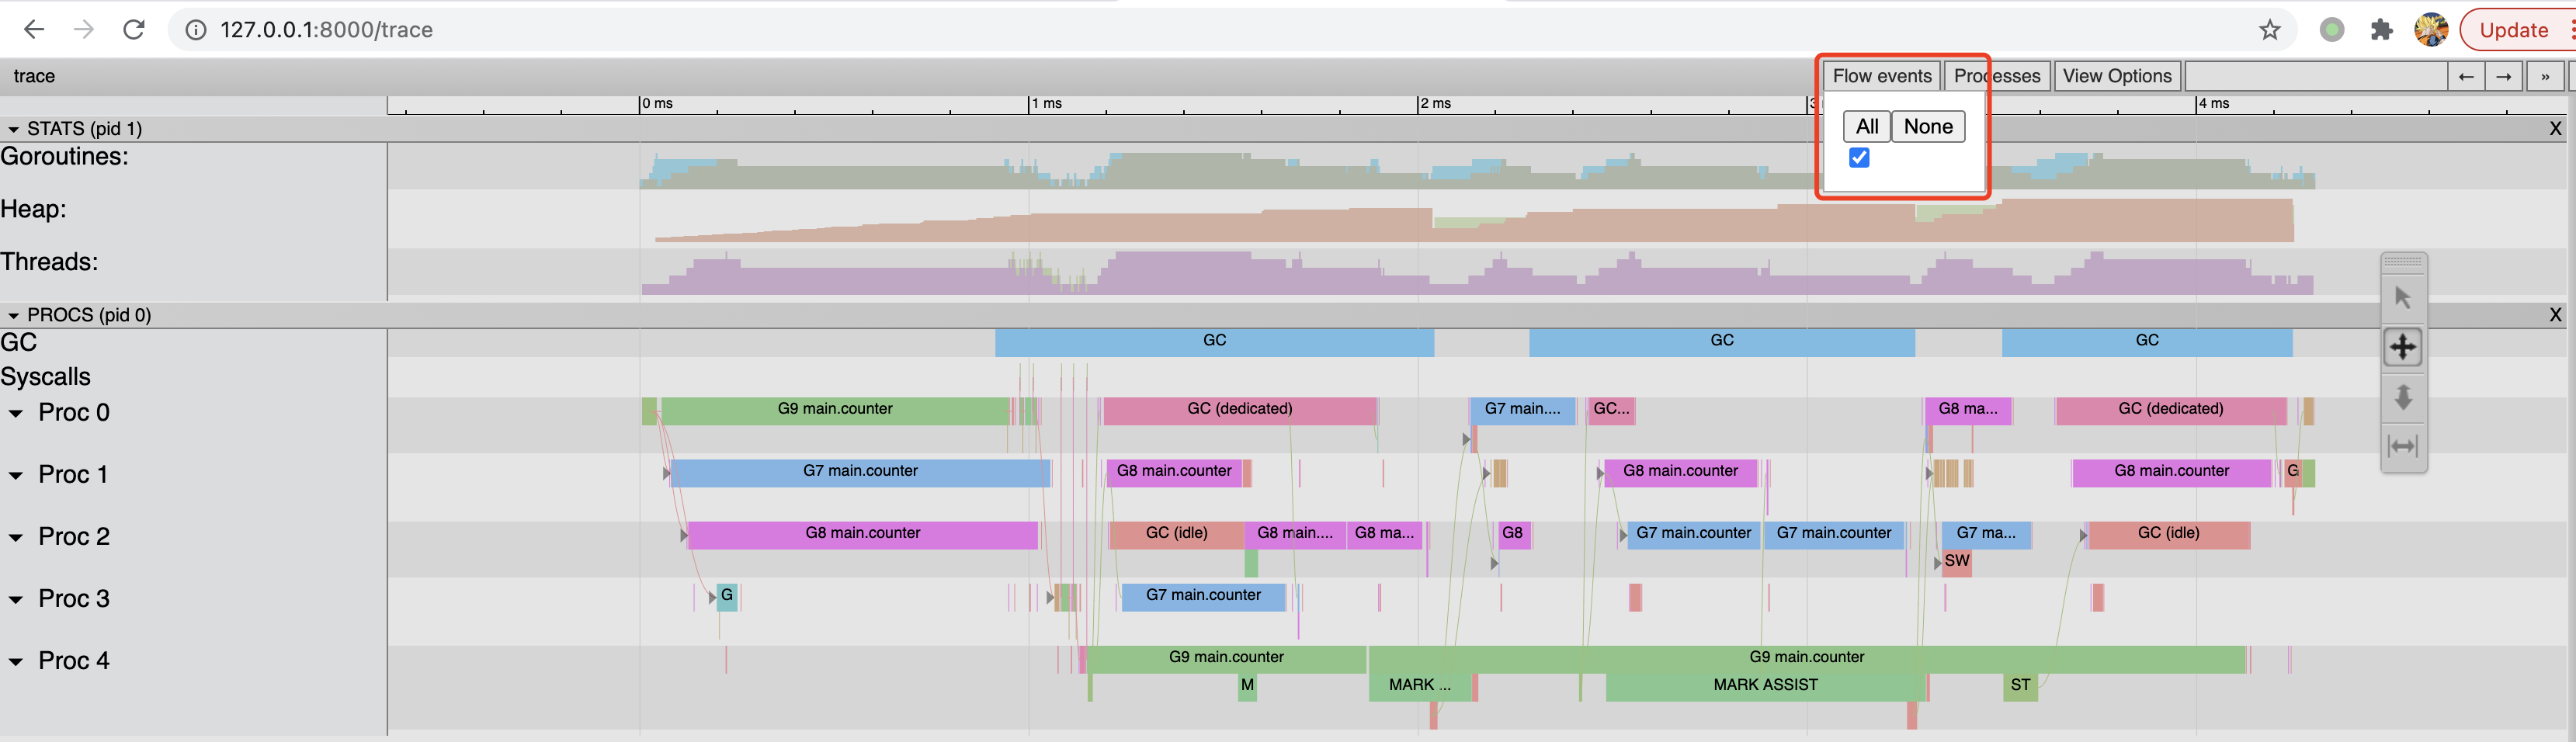
另外,trace 图还有很多功能,例如查看事件的关联信息等等,通过点击 Flow events/All 即可生成箭头表示相互关系,大家可以自己探究一下其他功能。
如果我们对 counter 函数的循环中加上锁会发生什么呢?
func counter(wg *sync.WaitGroup, mtx *sync.Mutex) {
	defer wg.Done()

	slice := make([]int, 0, 100000)
	c := 1
	for i := 0; i < 100000; i++ {
		mtx.Lock()
		c = i + 1 + 2 + 3 + 4 + 5
		slice = append(slice, c)
		mtx.Unlock()
	}
	hello = slice
}
2
3
4
5
6
7
8
9
10
11
12
13
生成 trace 图如下:
可以看到程序运行的时间又增加了,主要是由于加/放锁使得 counter 协程的执行时间变长。但是并没有看到不同协程对 CPU 占有权的切换呀?这是为什么呢?主要是这个协程运行时间太短,而相对而言采样的频率低、粒度大,导致采样数据比较少。 如果在程序中人为 sleep 一段时间,提高采样数量可以更加真实反映 CPU 占有权的切换。
如果对 go 协程加锁呢?
for i := 0; i < 3; i++ {
	mtx.Lock()
	go counter(&wg)
	time.Sleep(time.Millisecond)
	mtx.Unlock()
}
2
3
4
5
6
从得到的 trace 图可以看出,CPU 主要时间都是在睡眠等待中,所以在程序中应该减少此类 sleep 操作。
trace 图可以非常完整地跟踪程序的整个执行周期,所以大家可以从整体到局部分析优化程序。
我们可以先使用 pprof 完成初步的检查和优化,主要是 CPU 和内存,而 trace 主要是用于分析各个协程的执行关系,从而优化结构。
本文主要讲解了一些性能评测和 trace 的方法,仍然比较浅显,更多用法大家可以自己去探索。